astroML hacks at #SPIEastro 2014
We're hacking figures from the book "Machine learning, statistics, and data mining for astronomy and astrophysics"
We're hacking the astroML book figures.
This is a simple hack for fun and learning. Specifically, we're tweaking figures from the textbook "Machine learning, statistics, and data mining for astronomy and astrophysics" Contact gully at gully@astro.as.utexas.edu Here's what we did: We converted one frame of Figure 10.21 from the book to an interactive figure using MPLD3, which is a Python package that converts matplotlib plots into D3.js .html files. I then reused code from the MPLD3 examples to insert tool tips into the figure. The figure shows the properties of 6146 periodic variable stars from the LINEAR data set operated by MIT Lincoln labs. Using tool tips we can now instantly see the properties of individual objects.
Here's how much time is left in the hack day!
Here is a cool figure: 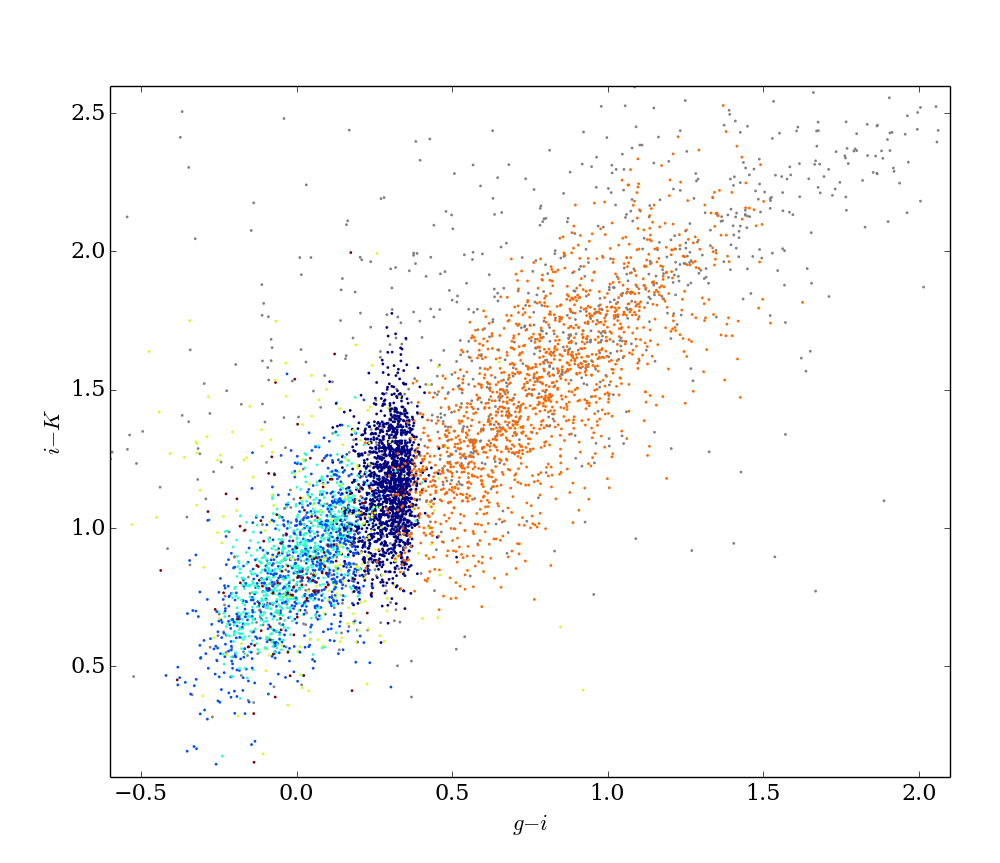
Here is another cool and interactive figure: